Published
- 4 min read
.Net static code analysis in Azure DevOps with Security Code Scan
You’ve probably heard about other SAST tools like SonarQube, but since Security Code Scan is a lesser known tool I’ll start off with a list of reasons why you might consider using it.
- Free with no features locked behind a commericial version
- There’s no restrictions such as only supporting the main branch like with SonarQube
- Low barrier of entry
- There is no seperate server to run, it runs completely within your pipeline so anyone can start using it without making infrastructure decisions
- Scan code without running a build
- With SonarQube .Net scanning you have to build your project, which means if you want to run it seperately from your main build pipeline you have to repeat the build
- Reports export to SARIF so can be consumed by other platforms
There are multiple different ways we can use Security Code Scan in an Azure DevOps pipeline, so let’s check out three options.
Following along
I’ll be using the ProCodeGuide.Samples.BrokenAccessControl repo as the target code of my scans.
All pipelines are being run on the Microsoft hosted build agents and the snippets displayed are just tasks within a yaml pipeline and are not all the yaml required for a working pipeline.
1. Scan code and view results using an extension
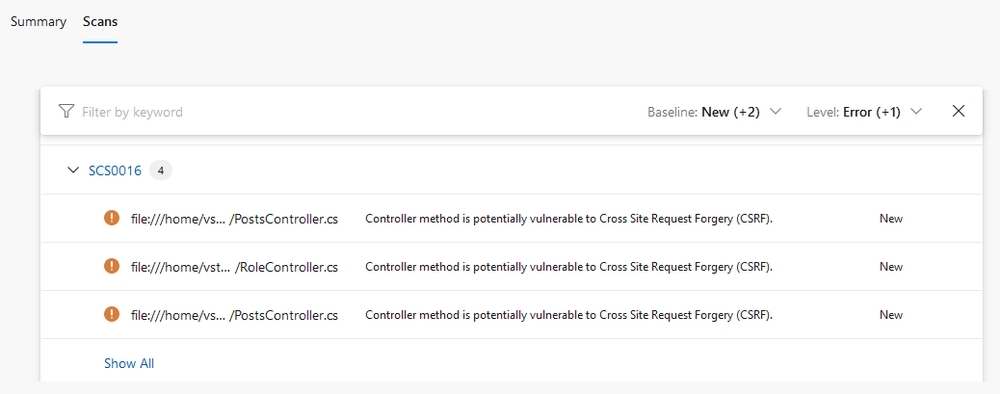
The SARIF SAST Scans Tab is an Azure DevOps extension that gives us a new ‘Scans’ tab on the build page to view the results of a published SARIF report.
After the extension is installed in your Azure DevOps organization, we just need a few steps in order to get some results from our pipeline:
- Install the Security Code Scan standalone tool
- Run a scan against our target solution/project
- Publish the SARIF report under the ‘CodeAnalysisLogs’ artifact name
       - task: DotNetCoreCLI@2
  inputs:
    command: 'custom'
    custom: 'tool'
    arguments: 'install --global security-scan'
- task: PowerShell@2
  inputs:
    targetType: 'inline'
    script: 'security-scan ProCodeGuide.Samples.BrokenAccessControl.sln --export=report.sarif'
- task: PublishBuildArtifacts@1
  inputs:
    PathtoPublish: 'report.sarif'
    ArtifactName: 'CodeAnalysisLogs'
    publishLocation: 'Container'
We now have some results in the Scan tab on the build
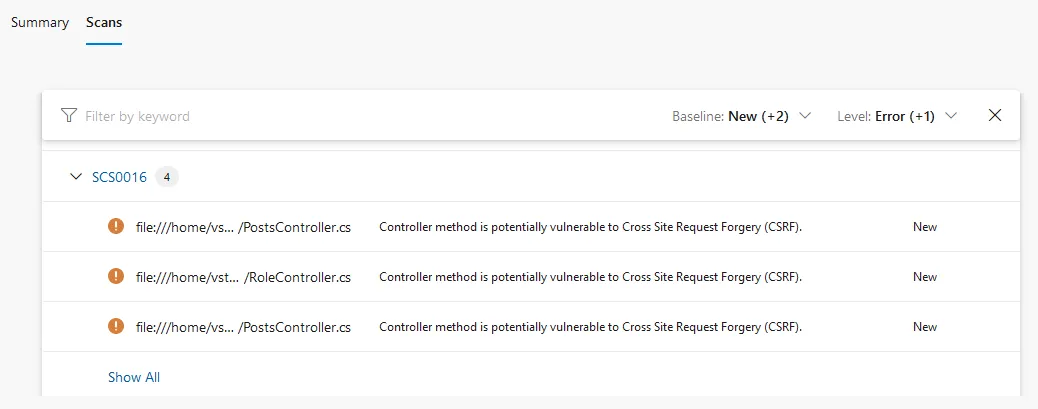
It tells us the vulnerability, the file it is in, and a handy link to more information about the rule with a potention solution to fix. Unfortunately, it does not include the line number. The report.sarif build artifact would have to be inspected to find line numbers.
2. Scan code and upload as test results
We’ll start off doing the same steps as the last one, but instead of publishing the report as a build artifact we’ll convert it to a JUnit report and upload it as test results. Before we can convert it, we’ll install a tool for converting SARIF to JUnit XML.
       - task: DotNetCoreCLI@2
  inputs:
    command: 'custom'
    custom: 'tool'
    arguments: 'install --global security-scan'
- task: PowerShell@2
  inputs:
    targetType: 'inline'
    script: 'security-scan ProCodeGuide.Samples.BrokenAccessControl.sln --export=report.sarif'
- task: Npm@1
  inputs:
    command: 'custom'
    customCommand: 'install -g sarif-junit@latest'
- task: PowerShell@2
  inputs:
    targetType: 'inline'
    script: 'sarif-junit -i report.sarif -o report.xml'
- task: PublishTestResults@2
  inputs:
    testResultsFormat: 'JUnit'
    testResultsFiles: 'report.xml'
And now the results show up as failed tests for the build
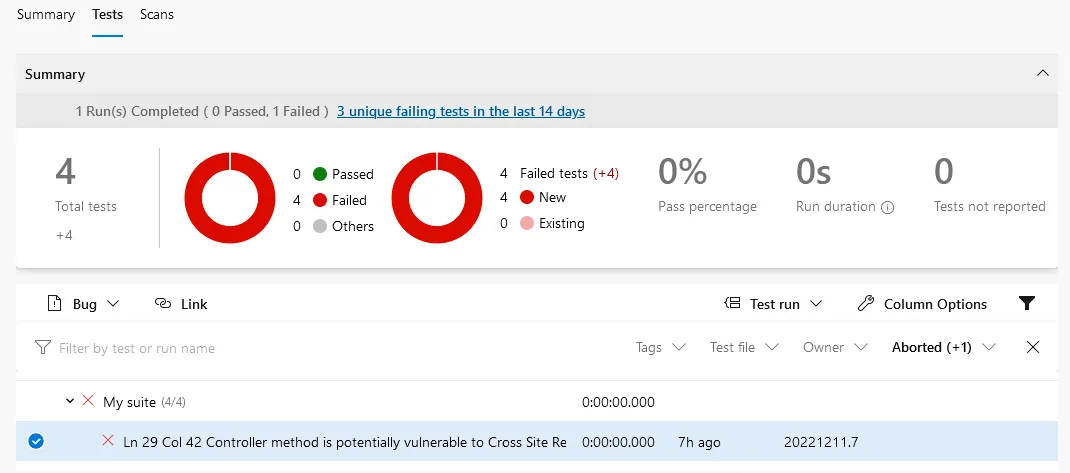
We have the vulnerability and the line it is on, but unfortunately the rule ID isn’t currently being included in the result details.
3. Display results in build output
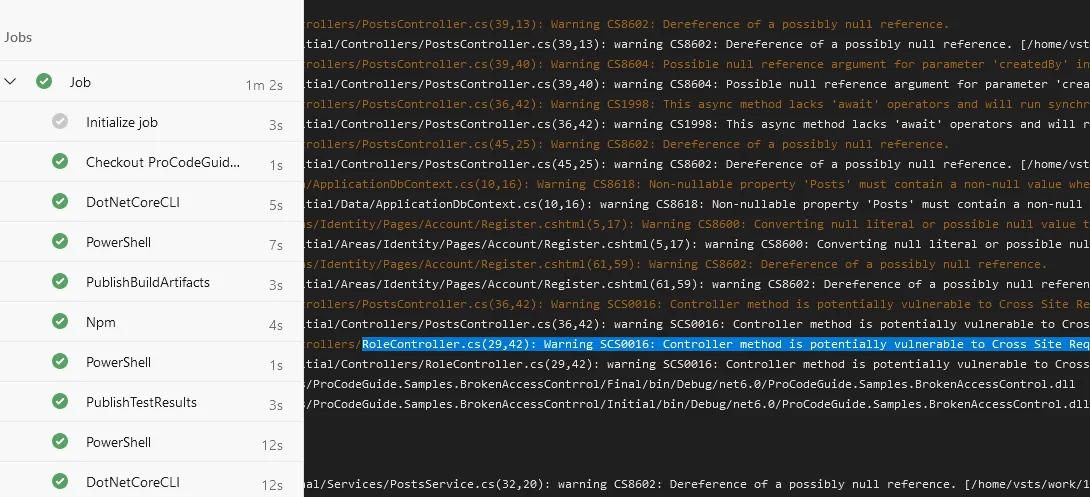
In order to scan and include results in the build output we need to take a completely different approach, instead of the standalone Security Code Scan package, we add the Security Code Scan package to each project and then run a build.
       - task: PowerShell@2
  inputs:
    targetType: 'inline'
    script: |
      dotnet sln list |
          Where {$_ -like '*.csproj' -and $_ -notlike '*Tests.csproj'} |
              ForEach-Object {dotnet add $_ package SecurityCodeScan.VS2019}
- task: DotNetCoreCLI@2
  inputs:
    command: 'build'
The scan results are now showing up in the build output. If you have noisy builds, they could be missed when showing up as warnings, but it would be possible to make them show as errors.
Conclusion
There are some tradeoffs in each of the methods of displaying the Security Code Scan results. You could decide upon multiple methods, or even improve upon the options shown here so that they meet your needs. However, the barrier of entry of getting some SAST running on your code can be very minimal with Security Code Scan, so keep it in mind when setting up your next build.